Modernizing the Horten H3 Airfoil
Full inverse redesign of the 1938 Horten H3 flying-wing airfoil: same pitching moment for unchanged trim and stability, ~10% less drag in the laminar bucket, a soft stall instead of a hard one — validated with CFD and converted into a glide-polar improvement.
The Horten flying wings: everything is wing
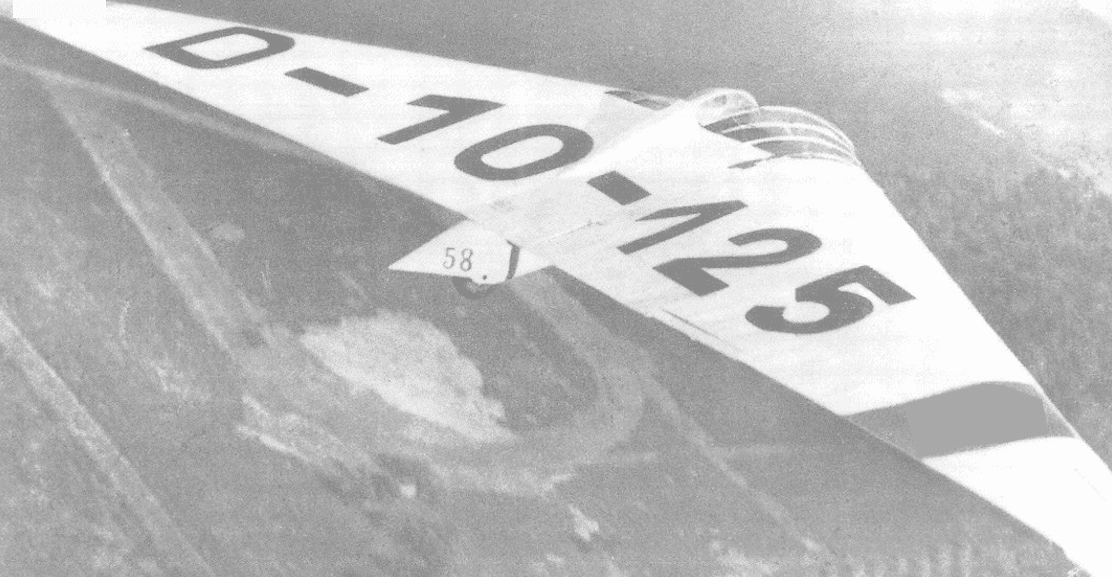
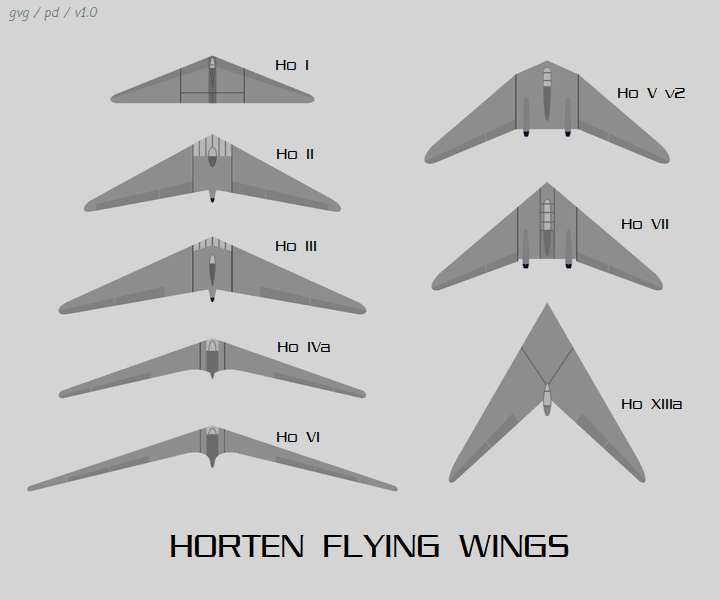
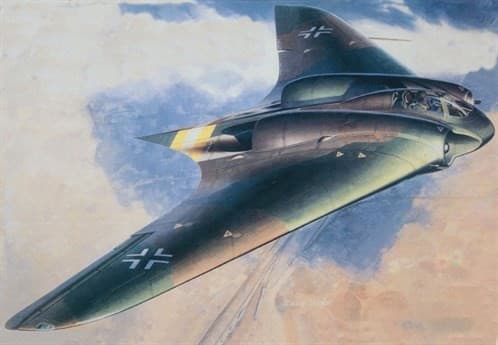
Between the 1930s and 1945 the Horten brothers built a family of tailless aircraft — from the H I training glider through the high-performance H VI sailplane to the jet-powered Ho 229 — all committed to one idea: delete everything that isn't wing. No fuselage, no fin, no tailplane. The payoff is real: the lowest-drag configuration a fixed-wing aircraft can have, less wetted area, less weight and structure, a higher lift-to-drag ratio and, incidentally, a small radar cross section.
The price is equally real. A flying wing has no tail lever arm to trim and stabilise with, so stability has to be baked into the wing itself — and every classical way of doing that costs some of the efficiency the configuration promised. The roll–yaw–pitch motions couple awkwardly, the shape makes a poor pressure vessel, and the aircraft is hard to modify once built, because the wing is doing every job at once.
This project, from the airfoil design course (Profilentwurf) at the University of Stuttgart's Institute of Aerodynamics and Gas Dynamics (IAG), takes the wing section of the Horten H3 — a 1938 glider — and asks a modern question: with today's design tools, how much efficiency can be recovered while keeping exactly the stability properties the Horten design depends on?
Why a tailless wing needs a special airfoil at all
Static longitudinal stability asks two things of an aircraft. It must be trimmed — the total pitching moment about the centre of gravity zero, so it holds its attitude — and it must be stable: pitch it up by a gust and the moment change must push the nose back down (dCm/dα < 0, achieved by keeping the centre of gravity ahead of the neutral point, with the stability margin measuring by how much).
A conventional aircraft satisfies both with the tailplane: the wing can use an efficient, strongly cambered airfoil with its inevitable nose-down pitching moment, and the tail — on a long lever arm — trims that moment away and provides the restoring slope. A flying wing has no lever arm. If its section carries the usual nose-down moment of a cambered airfoil, nothing can trim it: with the CG ahead of the neutral point for stability, the wing would simply tuck under.
That leaves two tools, and the Hortens used both. Reflex camber — bending the trailing edge back up — makes the airfoil itself carry a zero or slightly nose-up moment, at a typical cost of about 10% of lift. And wing twist (washout), geometric or aerodynamic, lets the outer wing behind the swept-back CG act as a built-in tailplane. The Hortens combined generous washout with a bell-shaped spanwise lift distribution — lift fading to zero at the tips — which as a bonus produces induced thrust at the tips (proverse yaw) and let them omit the vertical tail entirely.
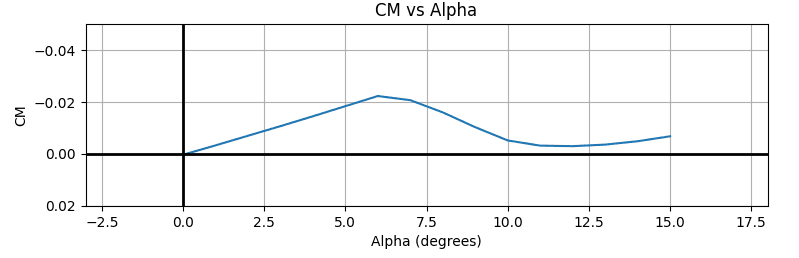
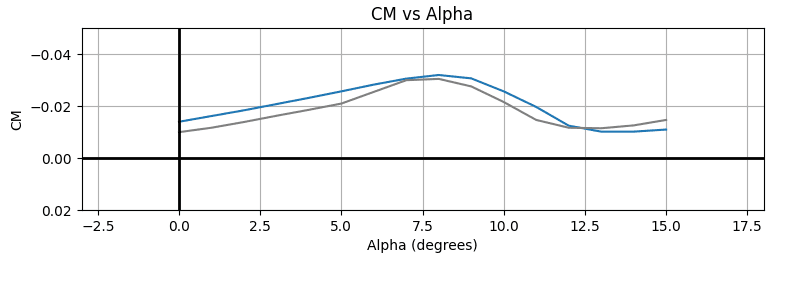
The consequence for this project: the H3's airfoil pitching moment is not a free parameter. Its magnitude and its slope with angle of attack are load-bearing properties of the whole aircraft's trim and stability — whatever the redesign improves, Cm(α) has to come out the same.
Anatomy of the original: 19.96% thick, gentle reflex, hidden vices
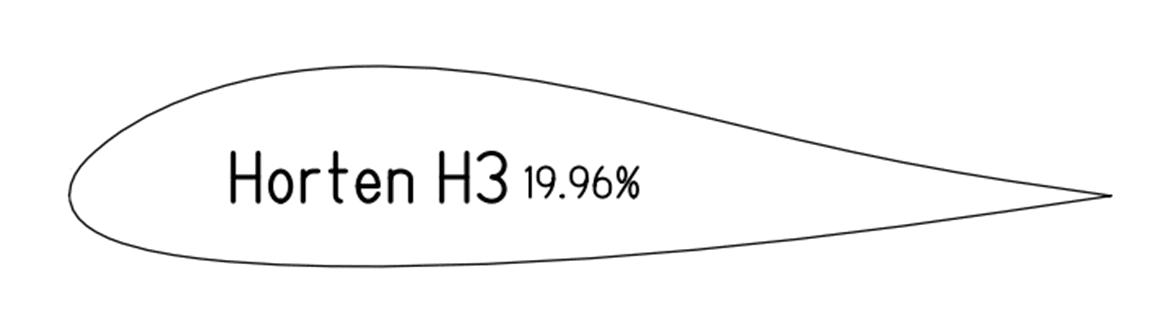
The starting point is the original Horten H3 root section — a 19.96%-thick reflexed airfoil, reconstructed and analysed with the same toolchain the redesign would use, so that every later comparison is like-for-like.
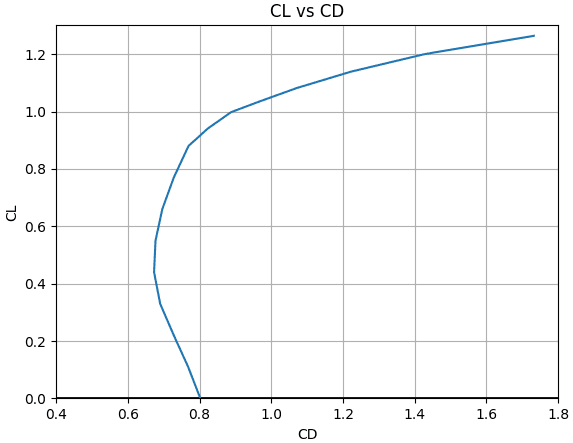
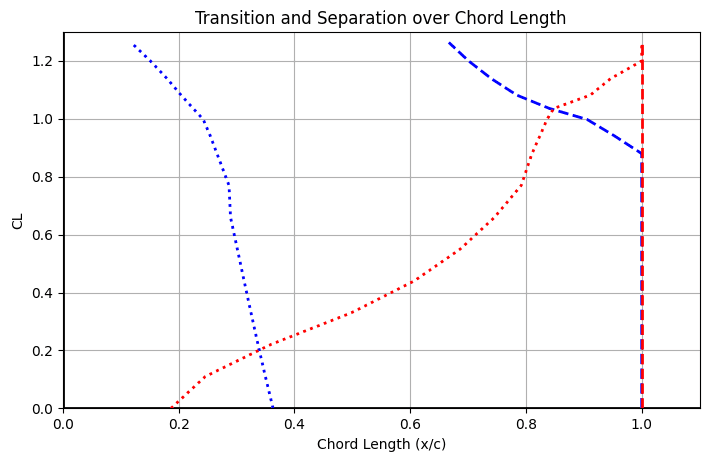
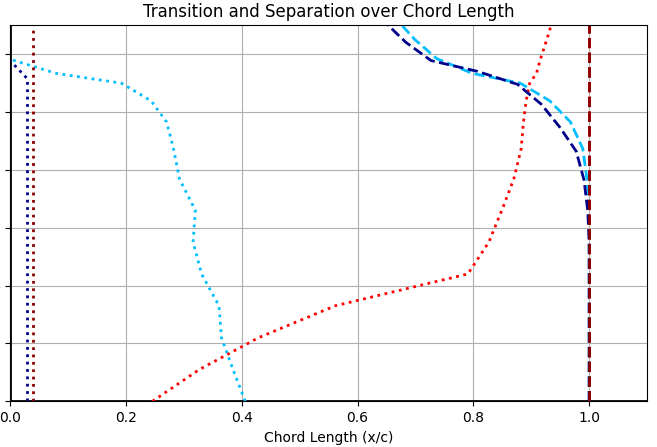
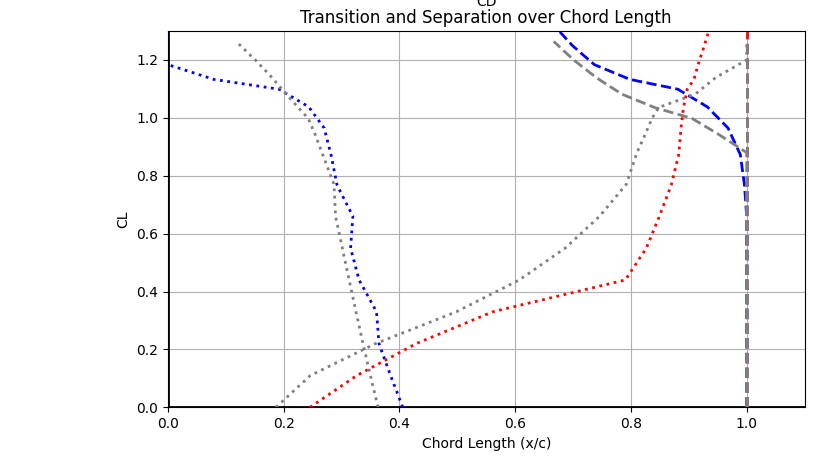
The analysis shows a well-behaved moment curve — Cm slightly negative and drifting mildly with angle of attack, exactly the near-zero moment a flying wing needs — but it also exposes the section's age. Transition on both surfaces happens early (laminar flow ends around 30% chord on the upper surface at moderate lift), the drag bucket is shallow, and the lower surface shows an abrupt transition behaviour that translates into a hard, sudden stall characteristic — an unpleasant trait in an aircraft with no tail to catch it.
The design conditions were fixed from the real aircraft: 100 km/h at a 3.25 m root chord gives Reynolds numbers from about 4.9 million at sea level down to 1.8 million at altitude; the design point was set at Re = 3 million.
Design criteria: improve everything, change nothing that matters
The task splits cleanly into hard constraints and objectives. Constraints: the new section must match the reference's pitching moment in both magnitude and slope dCm/dα — that is the flying-wing trim and stability contract — and the upper end of the laminar low-drag bucket must sit at a lift coefficient of 1.0, so the low-drag range covers the aircraft's actual operating band, all at the design Reynolds number of 3 million.
Objectives, in order: delay separation, soften the stall characteristic (in particular, eliminate the reference's hard-stall behaviour originating on the lower surface), improve lift-to-drag at the design point, and improve it across the rest of the envelope too.
In other words: keep the 1938 flying-wing DNA, remove the 1938 boundary-layer behaviour.
Inverse design: prescribe the flow, receive the shape
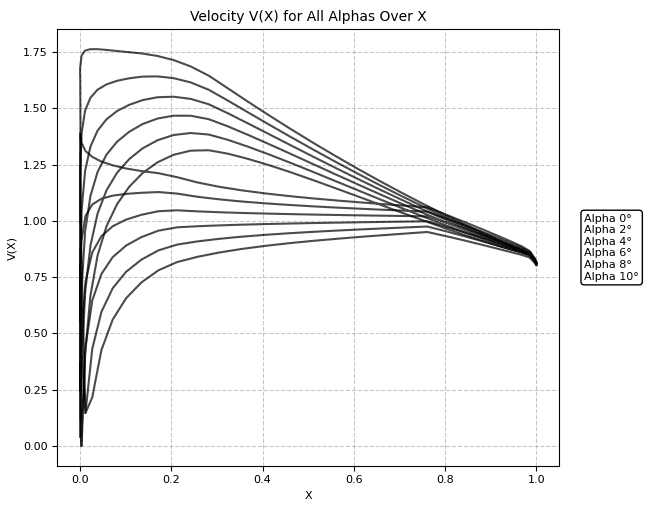
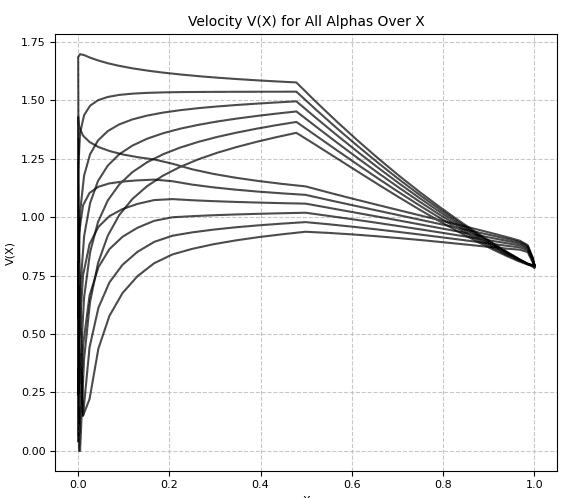
The redesign was done the Eppler way, using the inverse design toolchain from my own airfoil design code: instead of drawing geometry and checking the resulting pressures, the surface velocity distribution is prescribed segment by segment, and the geometry that produces it falls out of a conformal-mapping solution. Each forward segment carries a design angle of attack α* — the incidence at which its velocity is constant — so choosing the α* values directly chooses the lift range over which each surface stays laminar-friendly.
Aft of the laminar segments comes the main pressure recovery (HDA — the region where the flow is decelerated back towards the trailing edge), parametrised by its length, a shape parameter μ and a closure contribution ω. These few numbers per surface are the whole design vocabulary: they set how much lift the section carries, how aggressively pressure is recovered, how thick the airfoil turns out — and, decisive here, what pitching moment it ends up with.
Every candidate was then pushed through an integral boundary-layer analysis — transition prediction, separation monitoring, drag from the wake momentum deficit — so each design iteration returned not just a shape but a full polar with transition and separation positions. One loop takes seconds, which is what made the systematic Cm-tuning of the following chapters practical.
Learning to steer the pitching moment
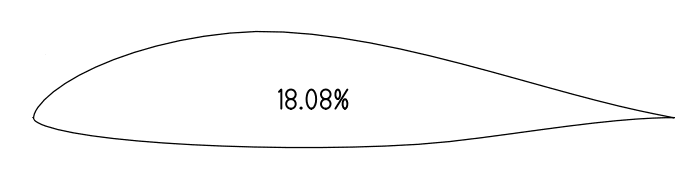
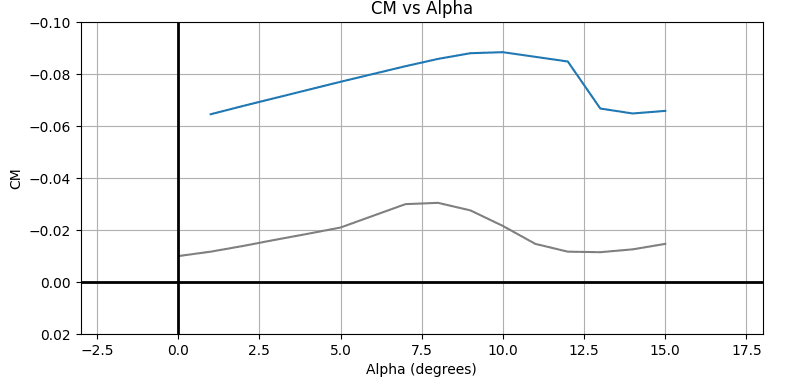
The first complete design set the upper surface's laminar bucket limit at α* = 9.5° and the lower at 3°, with gentle recoveries on both surfaces (upper HDA length 18, μ = −1, ω = 0.5; lower length 12, μ = −1, ω = 0.75). Out came a plausible 18.08%-thick section — whose pitching moment was roughly three times the reference's. Aerodynamically fine, but as a Horten wing section useless: that much nose-up moment would have to be trimmed away by even more washout, burning the efficiency the redesign was supposed to gain.
The fix required understanding which lever moves Cm. In this parametrisation the answer is clean: a longer or steeper recovery on the upper side shifts the moment nose-up, a shorter or shallower recovery on the lower side does the same — and the shape of the moment curve over α responds mainly to μ and ω on the upper surface. Comparing a reflexed against a normal trailing edge shows the mechanism directly: reflex unloads the aft camber line, and the recovery parameters control exactly how much.
With that mapping established, the moment could be dialled in deliberately instead of discovered accidentally — the point where the design process stopped being trial and error.
Suction peaks, a ramp, and the death of the hard stall
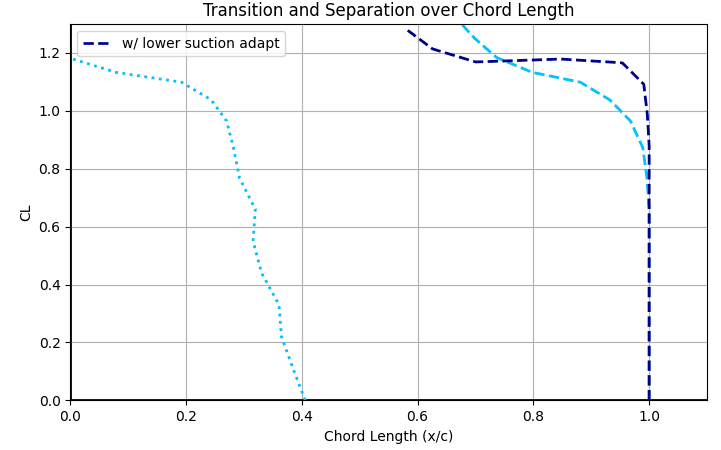
With the moment under control, the boundary-layer work began. First the suction peaks: local velocity spikes at the leading edge that trip the boundary layer early and, on the lower surface, were the root of the reference's hard-stall behaviour. Both surfaces were smoothed until the transition curves moved cleanly — the lower-surface adaptation visibly stretches laminar flow and removes the abrupt characteristic.
Then separation. The upper-surface recovery was made longer and shallower — recovering the same pressure over more chord keeps the turbulent boundary layer further from its separation limit — and a ramp was inserted ahead of the main recovery: a short, mildly decelerating region that walks the boundary layer through transition before the steep gradient hits, instead of slamming the laminar layer into it. The closure contribution ω was varied alongside to keep the contour closed and the trailing edge honest.
Each of these moves was checked in the same afternoon-long loop: adjust the velocity prescription, regenerate the geometry, run the boundary-layer analysis, read the transition/separation chart. Increasing lift, when needed, came from longer and steeper recoveries — bought consciously, because chapter 06 established exactly what that does to the moment.
15.86% thick, same moment, ten percent less drag
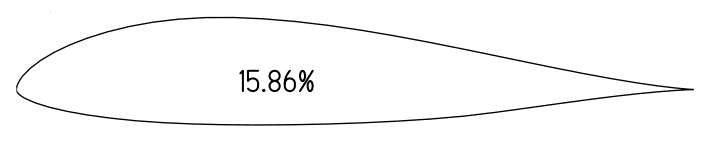
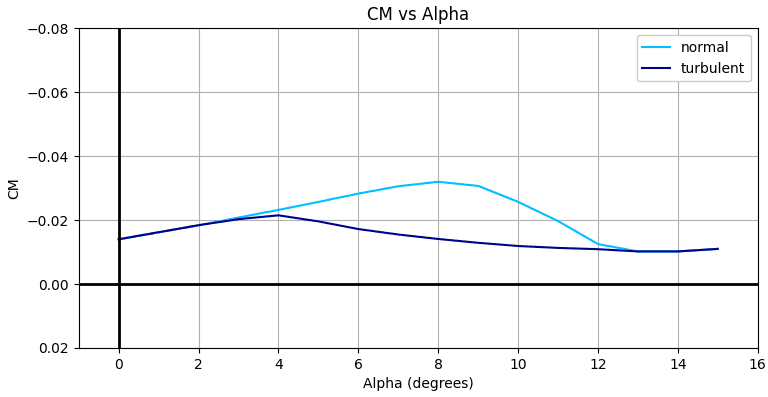
The converged section is 15.86% thick — four points thinner than the original, still ample for a glider spar — and puts the numbers where the brief asked. The pitching-moment curve lies on top of the reference's in both magnitude and slope: the flying-wing trim contract is honoured, and the H3's washout schedule would not need to change.
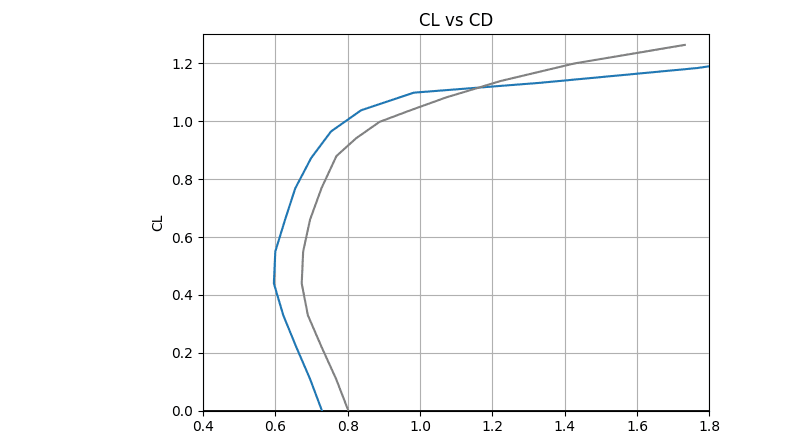
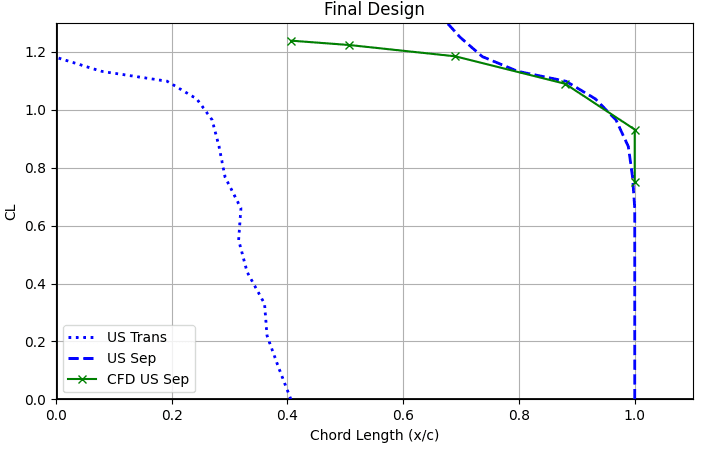
Inside the low-drag bucket the drag drops from about 68 to about 60 counts — roughly a 10% improvement at the design lift range — with the bucket's upper edge at Cl = 1.0 as required. The transition chart explains where the gain comes from: laminar flow now survives noticeably further aft on both surfaces across the whole operating band, and turbulent separation stays glued to the trailing edge until the top of the lift range, a touch later than the reference.
The reference still wins above Cl ≈ 1.15, where its greater thickness and camber keep drag growing more slowly — but that corner of the polar is climbing flight at the edge of stall, not where a cross-country glider lives.
Stress-testing: Reynolds sweep and a fully turbulent day
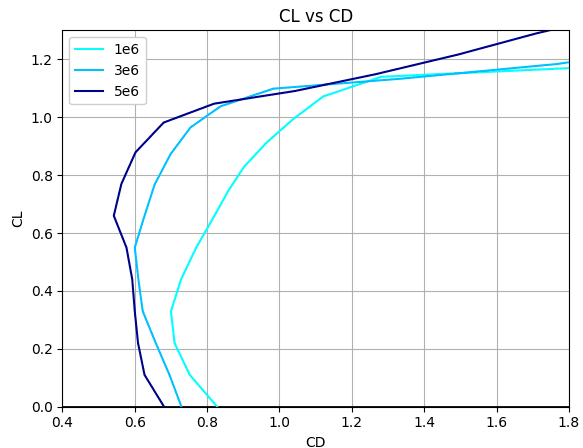
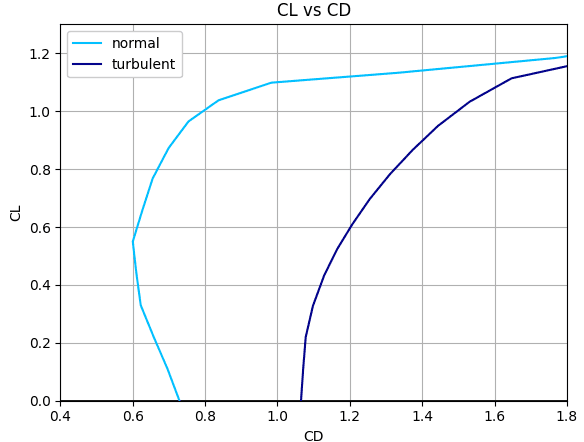
A glider section never flies at exactly its design point, so the final design was swept across the envelope. Between Re = 1, 3 and 5 million — spanning the aircraft's altitude and speed range — the polar behaves monotonically: the bucket deepens with Reynolds number, no laminar-separation surprises appear at the low end, and the moment curve stays put. The design point at 3 million is a genuine middle, not a cliff edge.
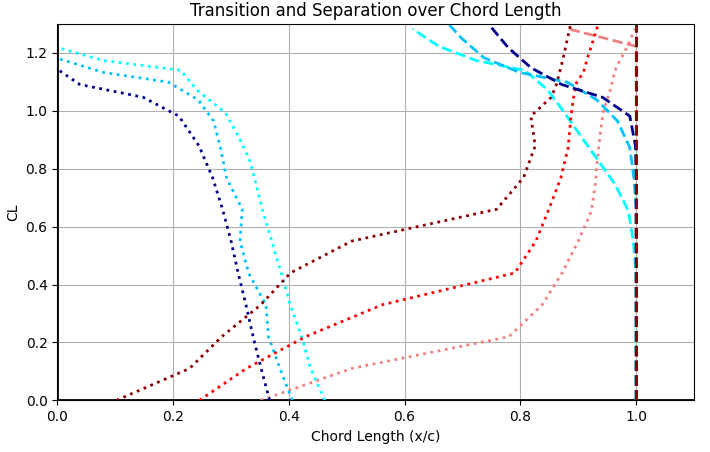
The harsher test is forced transition — simulating rain, bugs or age roughening the leading edge so all laminar flow is lost. Drag rises accordingly, as it must, but the polar stays smooth, separation behaviour remains benign, and the pitching moment actually flattens slightly. A laminar design that degrades gracefully when the laminar flow is taken away was an explicit goal for an aircraft with no tail to mask bad behaviour.
Checking the panel method's homework with CFD
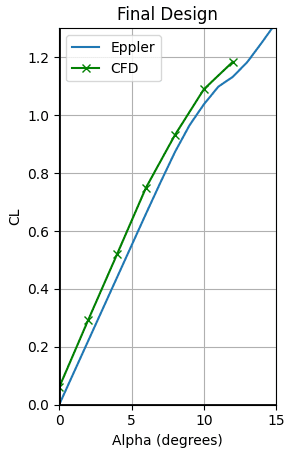
The design loop runs on a coupled potential-flow and boundary-layer model — fast, but built on assumptions that deserve an independent check, especially near stall where those assumptions fray. So the final section went through a viscous CFD simulation and the two solvers were compared on the quantities that matter.
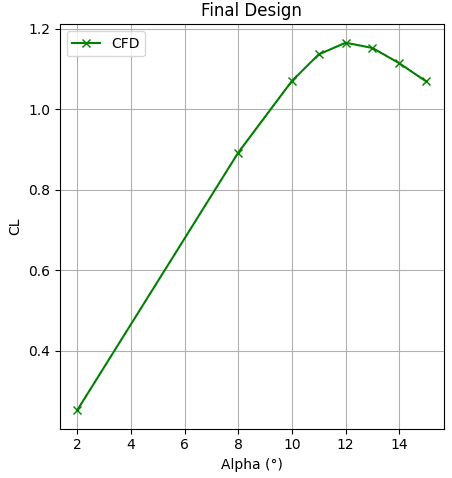
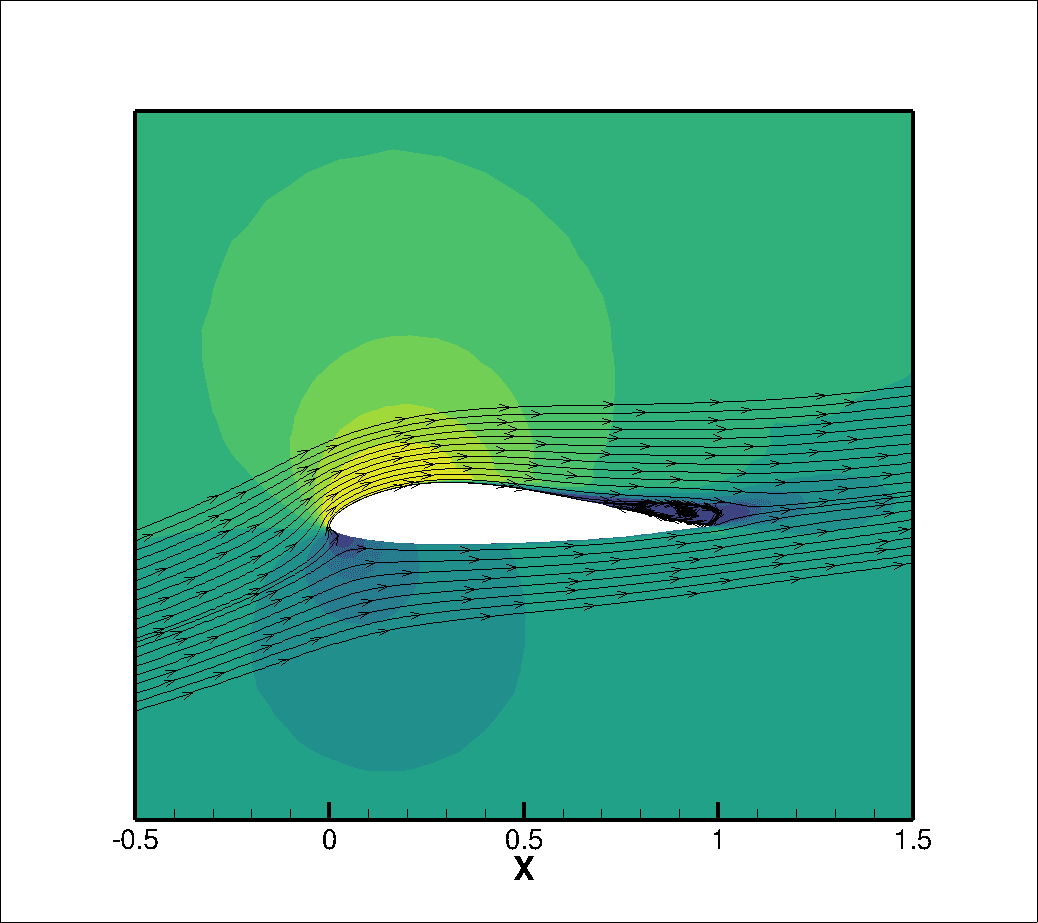
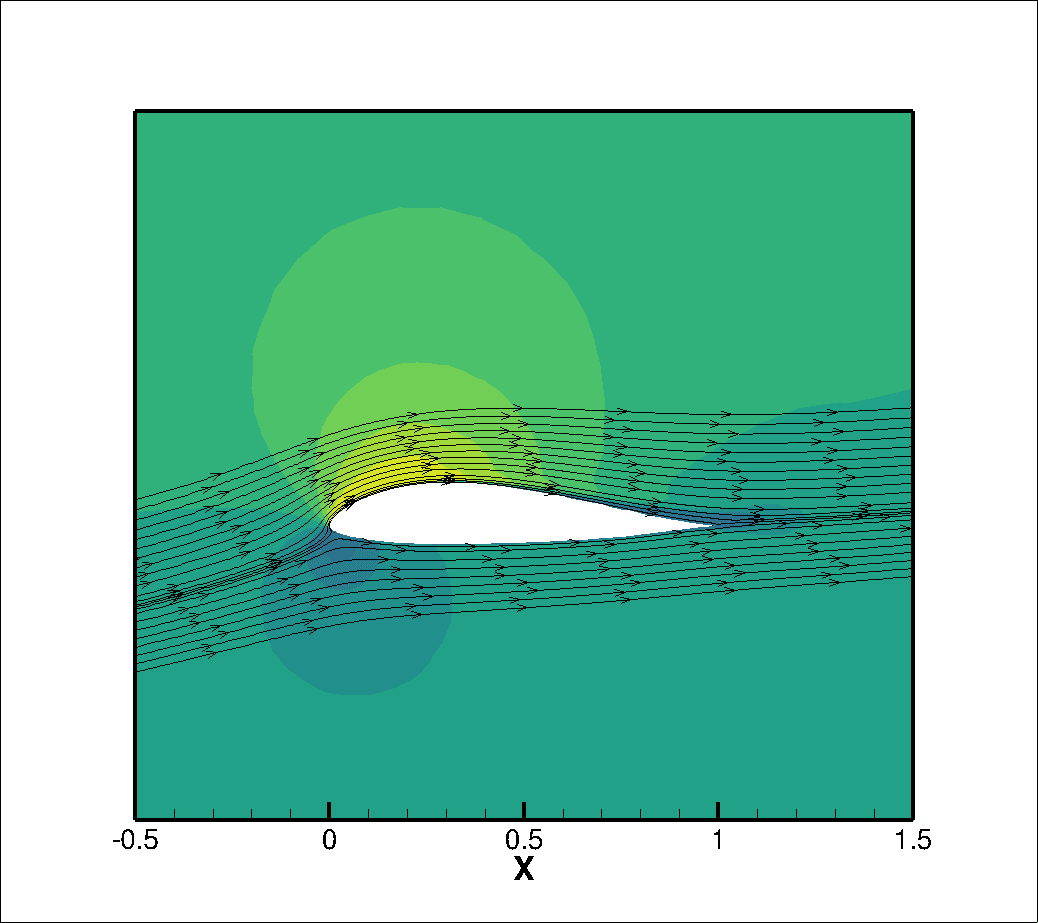
The agreement is close where it should be: the lift curves track each other over the whole linear range, and the CFD-resolved upper-surface separation point follows the boundary-layer method's prediction remarkably well as lift increases. The CFD adds what the design tool cannot say: maximum lift lands at about Cl = 1.17 at 12° incidence, and beyond it the lift curve rounds over gently rather than breaking — trailing-edge separation creeping forward, visible in the flow fields at 8° and 14°, instead of a leading-edge collapse.
That gentle stall is the payoff of the chapter-07 work, confirmed by higher-order physics: the hard-stall characteristic the reference section carried is gone, on an aircraft where a sudden asymmetric stall has no vertical tail to catch it.
What the aircraft gets out of it
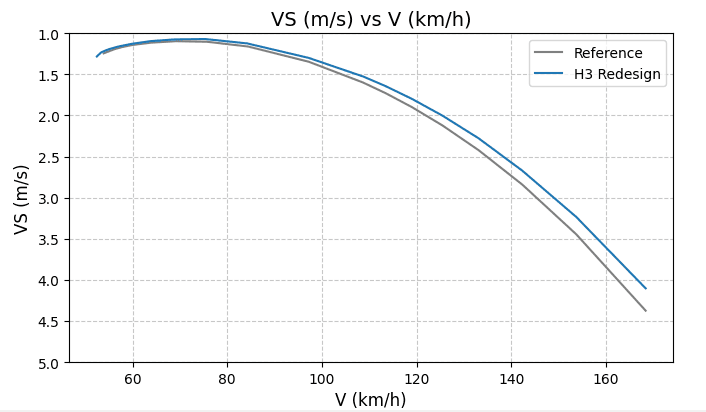
Airfoil polars are means, not ends, so the last step converts them into aircraft performance: a glide polar — sink speed against airspeed — computed for the H3 with the original and the redesigned section. Minimum sink is essentially unchanged (that regime is dominated by induced drag, which the airfoil cannot touch), but from about 90 km/h upward the redesign sinks visibly less at every speed, and the advantage grows with speed — exactly the cruise band where a cross-country glider spends its life between thermals.
The historical note makes it satisfying: the redesign carries the same pitching moment, so it could notionally be fitted to the 1938 aircraft without changing its twist, trim or handling — it would simply glide flatter. The 86 years of aerodynamics between the original and the redesign compress into three ideas: keep the boundary layer laminar longer, recover pressure with discipline, and know precisely where transition and separation live.
Beyond the numbers, the project was the proving run for my own inverse airfoil design tool on a real, constrained design problem — the full loop of requirement, parametrisation, iteration, off-design analysis and independent CFD validation that section design actually consists of.